Signal Processing for Steel Drum Leak Detection Based on Time-Frequency Domain (3)
Van Persie
Chapter III Time-Frequency Analysis of Leakage Acoustic Signals
This paper utilizes MATLAB software to perform time-frequency analysis on the acoustic emission signals of steel drums. Based on the collected acoustic emission data, the sampling frequency is set at 1000 kHz with 2048 sampling points. The time domain and frequency domain of the signal are analyzed separately.
3.1 Frequency Domain Analysis of Leakage Signals
The acoustic emission signal from a leaking steel drum has a broad spectrum, including both audible and ultrasonic frequency components. These components may propagate along the leaking path to the sensor, resulting in a complex composition in the sensor’s recorded signal [1]. As shown in Figure 3.2, there is a noticeable leakage signal in the 0–150 kHz range. To detect the leak, we need to focus on specific frequency bands while filtering out unwanted noise.
3.1.1 Spectrum Analysis
Fourier transform is an effective method for analyzing signals, enabling the decomposition of signal components and their reconstruction [2]. MATLAB provides various functions such as fft, wewt, fft2, and ift2 for fast transformations. Among these, fft2 and ifft2 are used for two-dimensional discrete data, while fft and ift are for one-dimensional data. Since MATLAB does not support zero-based indexing, subscripts are shifted right by one.
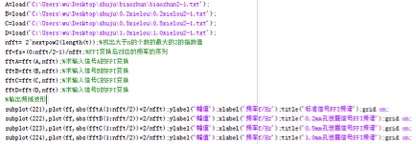
Figure 3.1 FFT Part of the Program Code
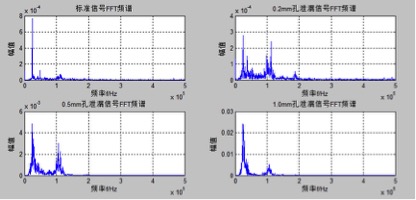
Figure 3.2 Spectrogram of the Acoustic Emission Signal
The waveform in Figure 3.2 was obtained using FFT. Comparing the FFT of the leakage signal with a standard signal, it is evident that the leakage signal has a much higher amplitude around 110 kHz. As the aperture size increases, the amplitude near 110 kHz also increases. Therefore, the characteristic frequency of the leaked acoustic emission signal is approximately 110 kHz, while the noise frequency is around 25 kHz.
3.1.2 Noise Reduction of Leaking Acoustic Emission Signals
The acoustic emission signal from a leaking steel drum passes through various components such as the steel wall, sensor, acquisition card, transmission equipment, and amplifier, introducing significant noise. This noise can distort the original signal and reduce detection accuracy. Hence, noise reduction is essential to enhance the true signal strength.
Based on the FFT spectrogram, the leakage signal has two main frequency peaks: one for noise and another for the characteristic frequency. Given that the characteristic frequency is around 110 kHz, we use an FIR bandpass filter to remove high and low frequency components. This approach is suitable for non-stationary signals like those from steel drum leaks.
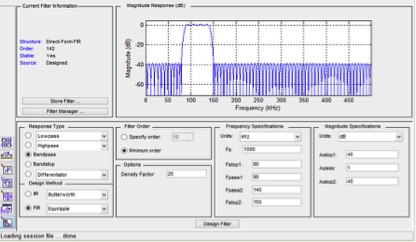
Figure 3.3 FIR Filter Interface
Using MATLAB's FDATool, we designed an FIR filter as shown in Figure 3.3. The initial design of the filter includes parameters such as: bandpass response, equal ripple design, minimum order, density factor of 20, sampling frequency of 1000 kHz, passband frequencies of 90–140 kHz, stopband frequencies of 80–150 kHz, and a passband ripple of 1 dB with stopband attenuation of 40 dB.
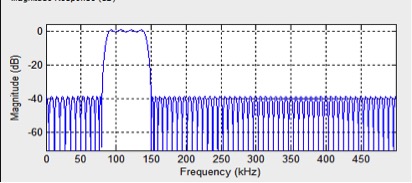
Figure 3.4 Amplitude-Frequency Map
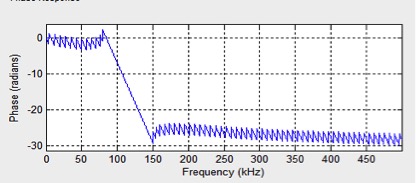
Figure 3.5 Phase Delay Diagram
After applying the designed filter to the collected signal, the filtered time-domain waveform is shown in Figure 3.7. Compared to the unfiltered version, the low-frequency noise is reduced, making the signal clearer. However, some irregular pulses appear due to the filter’s transient response.
3.1.3 Power Spectrum Estimation
The purpose of power spectrum estimation is to describe the frequency distribution of a signal based on finite data. After filtering, the power spectral density of the steel drum’s acoustic emission signal is shown in Figure 3.9. The results indicate that the maximum spectral density increases with the leakage aperture. If the maximum exceeds 110-5, it suggests a potential leak.
3.1.4 Hilbert-Huang Transform (HHT)
HHT is used to analyze the local characteristics of the acoustic emission signal. Empirical mode decomposition (EMD) breaks down the signal into intrinsic mode functions (IMFs), which are then analyzed via Hilbert spectrum. The first IMF corresponds to the leakage signal at around 110 kHz, while the second IMF represents noise at 25 kHz. The marginal spectrum shows that larger apertures result in higher energy levels.
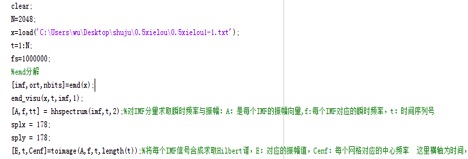
Figure 3.10 Empirical Mode Decomposition Partial Program Code

Figure 3.11 Empirical Mode Decomposition of Leakage Signal
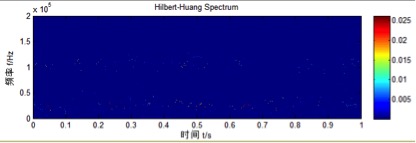
Figure 3.12 Leakage Signal Hilbert Spectrum
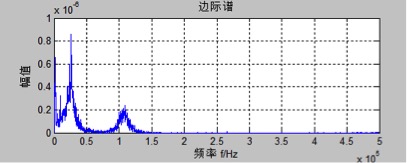
Figure 3.13 Leakage Signal Marginal Spectrum
The marginal spectrum analysis reveals that as the leakage aperture increases, so does the energy level. If the marginal spectrum exceeds 1.3, it indicates a possible leak.
3.2 Time Domain Analysis of Leakage Signals
3.2.1 Time Domain Simulation Waveforms and Their Distribution
The amplitude of the leakage signal varies with the aperture size. By plotting the time-domain waveforms, we observe how the signal changes over time. In real-world scenarios, weak signals are amplified before being converted into digital data for further processing. As shown in Figure 3.15, the simulated waveforms for different aperture sizes (ABCD) show varying amplitudes.
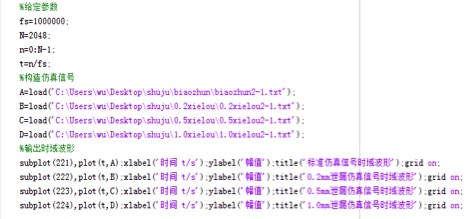
Figure 3.14 Drawing Time Domain Waveform Program
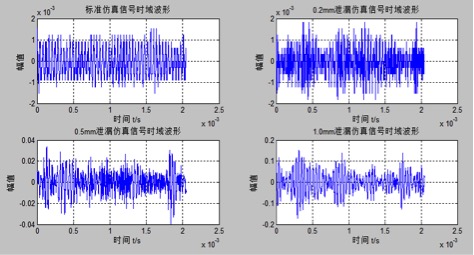
Figure 3.15 Steel Drum Acoustic Emission Signal Time Domain Waveform
A table (Table 3.1) summarizes the relationship between aperture size and signal amplitude. It shows that as the aperture increases, the amplitude also increases. The curve in Figure 3.16 illustrates this trend, showing that larger apertures lead to more dispersed amplitudes.
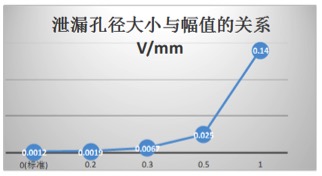
Figure 3.16 Relationship Between Leakage Aperture and Amplitude
3.2.2 Mean (SAL) and Root Mean Square (RMS) of Acoustic Emission Time Domain Signals
Time-domain feature parameters like mean and RMS help describe random signals. Experiments were conducted on steel drums with different aperture sizes, and the results are summarized in Table 3.2. The RMS values increase with the aperture size, indicating that larger leaks produce stronger signals.
Table 3.2 Calculation Results of Time Domain Feature Quantities
0mm (Standard)
0.2mm
0.3mm
0.5mm
1.0mm
Amplitude Size v
0.0012
0.0019
0.0067
0.025
0.14
The RMS values provide a reliable indicator for detecting leaks, as they correlate directly with the size of the aperture.
3.3 Summary of This Chapter
This chapter discusses the characteristics and processing methods of leakage signals, focusing on time-domain RMS, FFT, power spectrum, and Hilbert transforms. The self-developed system for steel drum leak detection was used to analyze and process the acoustic emission signals. The results are summarized in Table 3.3, showing that as the aperture increases, the RMS, FFT amplitude, power spectrum, and marginal spectrum all increase.
Table 3.3 Signal Characteristic Parameters of Different Leakage Apertures
Mean Square Value (RMS)
FFT Maximum Amplitude
Power Spectrum Maximum Amplitude
Marginal Spectrum Maximum Amplitude
Standard (0mm)
0.000176075
0.00010011
5.1312e-06
9.6792e-09
0.2mm
0.000386193
0.00021886
2.4524e-05
2.24584e-08
0.5mm
0.00511135
0.0031134
0.004963
4.8933e-07
1.0mm
0.0106125
0.0055116
0.015553
8.8119e-07
According to Table 3.3, the frequency domain features and RMS of the acoustic emission signal increase with the aperture size. This confirms the effectiveness of the proposed signal processing techniques in detecting leaks.
[1] Jiang Tao. Application research on pipeline leak detection and location [D]. Harbin Engineering University, 2008.
[2] Yang Lijuan, Zhang Baihua, Ye Xuyu. Fast Fourier Transform FFT and its application [J]. Photoelectric Engineering, 2004, 31 (supplement): 1-7.
[3] Hu Liying, Xiao Peng. Application of fast Fourier transform in spectrum analysis [J]. Journal of Fujian Normal University (Natural Science Edition), 2011 (04).
[4] Song Aiguo, Liu Wenbo, etc. Test signal analysis and processing [M]. Mechanical Industry Press, 2007.
[5] Huang Zhenfeng, Wu Jiangjun, Mao Hanling. Filter parameter setting method for metal crack acoustic emission signal FIR filter design [J]. Journal of Hebei University of Technology, 2007 (01): 36.
[6] Yu Hao. Research on acoustic emission technology (AE) monitoring system for oil pipeline leakage [D]. Xi'an University of Science and Technology, 2009.
ã€Related Links】
Steel Drum Leak Detection Signal Processing Based on Time-Frequency Domain (1)
Steel Drum Leak Detection Signal Processing Based on Time-Frequency Domain (2)
Steel Drum Leak Detection Signal Processing Based on Time-Frequency Domain (3)
Steel Drum Leak Detection Signal Processing Based on Time-Frequency Domain (4)
Steel Drum Leak Detection Signal Processing Based on Time-Frequency Domain (5)
Biodegradable Plastic Supermarket Bags
The 100% biodegradable plastic bags provided by our company have the following characteristics:
1. Our biodegradable plastic bags are made of 100% biodegradable resin as raw materials, free of plastic, non-toxic and harmless.
2. All the biodegradable plastic bags can be fully degraded, and have passed the American ASTM-D6400 and EU EN13432 compostable certification Standard test.
3.Bury the used biodegradable plastic bags in the soil, or bury them in the environment with microorganisms.
The compost can degrade 100% into carbon dioxide and water in 3 months and become organic fertilizer without white pollution
4. Our compostable plastic bags are waterproof and oil-proof, and will not leak.
5. The biodegradable bag has toughness, softer hand feeling and strong tensile properties. The blown technology is close to LDPE, and the weighing capacity is above 5-30 kg.
Main applications: household garbage bags, supermarket shopping bags, food packaging bags, clothing packaging bags, express packaging bags, agricultural mulch
Biodegradable Food Bags,Biodegradable Grocery Bags,Biodegradable Supermarket Bags,Biodegradable Shopping Bags
Shaoxing Greenstar New Material Co.,Ltd , https://www.greenstarpackage.com